Some more data on Venture outcomes
Quick update here. The data I site below is from Foundry LP StepStone. Since my original post I’ve confirmed with them that they’re ok with my identifying them as the source of the data. And they’ve offered to help me play with the raw data of a future report – I’ll work on some interesting updates here soon!
Yesterday’s post on venture outcomes – Venture Outcomes are Even More Skewed Than You Think – generated lot of traffic. Clearly, it’s interesting to put real data against a heuristic and see how reality maps to our expectations. As I pointed out in my post, the data set from Correlation Ventures I was working with had some limitations. For starters, I didn’t have the raw data to run my own cuts of the analysis. And more importantly the data were financing level, not company level. A bunch of people asked me about this and I’m working with Correlation to see if the next time they do this analysis we can get a few different views of the data.
In the meantime I went poking around for some additional information and remembered an analysis that one of our investors sent me on roughly the same subject. I thought given the interest in my last post I’d put it up for further discussion. Still not exactly how I’d parse this if I had access to the full data set, but interesting nonetheless. This analysis is on a company basis, not a financing basis (the chart is labeled “Deal” but in this case that means company, not round). I should also note that its skewed a bit towards better performing funds. This was an internal analysis by an LP so I’m not able to release the full report but the data set represented over 3,000 companies and more than $20Bn in invested capital and spanning years 1971 through 2012. The data only represent companies that have exited (and not, for the more recent fund vintages, companies current carrying value). It’s also worth noting that this data set likely shows a slight upward bias, reflecting this LPs selection over the years of better performing funds vs the VC average (from the internal report: “In our view, the data set is skewed toward higher quality funds; the average returns of these deals across vintage years outperform the VC average.”).
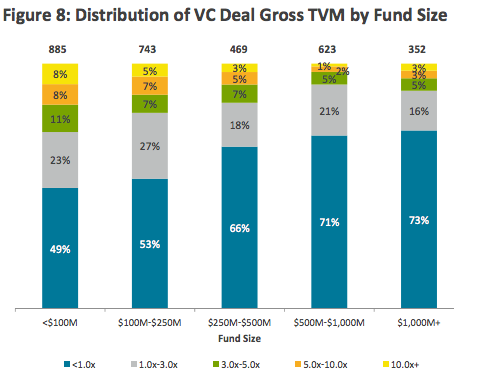
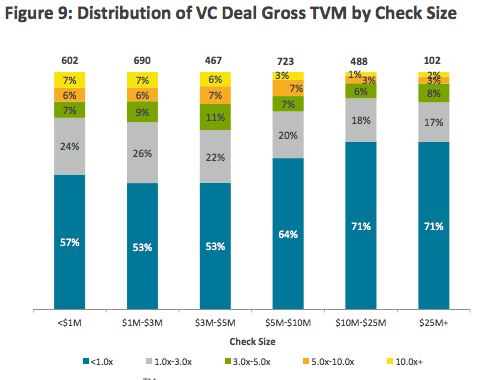
The first chart below shows the distribution of venture outcomes by fund size. Interestingly, the loss ratio of smaller funds (where outcomes are <1x) is smaller as a percentage of the portfolio than for larger funds. 49% of deals for funds smaller than $100M fail to return capital, while 73% of deals from larger funds failed to do so. The top end showed the same trend between small and large funds – smaller funds were significantly more likely to produce exits of 5x or greater vs large funds. These data largely track to investment size with larger checks producing not only fewer outsized winners (as you might expect given the nature of larger rounds) but also producing far more companies that failed to return capital (which you might not expect given the nature of the types of deals that raise larger amounts – stage, risk profile and investment structure).


One obvious conclusion from these data (and something I’ve seen supported by other data sets as well, although I haven’t written about directly before) is that smaller funds outperform larger funds. There’s more to that argument than is contained in the charts above (with well in excess of 50% of all deals failing to return capital, there’s plenty of devil in the details to make that conclusion) however the report I pulled these from – the writers of that report had the full data, of course – clearly articulated that as one of their conclusions. More on that in a separate post at some point. These numbers generally support the conclusions I drew yesterday about the challenge of finding unicorn investments. But the data also suggest that while they don’t truly follow the 1/3, 1/3, 1/3 heuristic, smaller funds come closer to that hypothetical portfolio distribution than do larger funds (at least above average funds do). In this data set, funds smaller than $250M invest in companies generating greater than 3x return 23% of the time and fail to return capital on a little over 50% of their investments. This compares to less than 10% of investments by funds greater than $500M generating a 3x return and almost 72% failing to return capital.
All of the data aside, it’s clear that venture returns are generated by a minority of funds that find themselves in the outlier deals (and that being a successful venture capitalist is quite difficult).

